Vision-Based Diagnostics
Contact us

In large complex process plants like nuclear power and petroleum installations, there are many sources of potentially important information which, due to a lack of adequate instrumentation, are not readily available to the operators in the control room or to the maintenance crew. Normally, information is collected and checks are performed by field operators and technicians. However, in time-critical operations when there is a need for access to hazardous areas (like high irradiation, high temperature, hot steam leakage, fire, risk for gas explosion, etc.) this work practice may reduce the plant’s overall safety and increases the risk for personnel injury. By introducing different kinds of multimedia techniques and integrating them into the plant’s ordinary process surveillance & control system, this shortcoming might be significantly reduced.
Of particular importance is the need to evaluate the physical condition of process equipment, and to get early warnings on impending hazardous failures. Automatic temperature monitoring can be achieved by performing image analyses of thermographic images of heat exchangers, pumps and piping, as well as detecting fire and smoke, small obstructions in flows etc., and may facilitate such evaluations.
In addition, ordinary visual light cameras (such as standard surveillance cameras) may be used for e.g. steam detection. Automatic monitoring and detection of such “anomalies” and image sequence recording (for subsequent playback) would facilitate the localization of such anomalies.
Vision tool features
For the above-mentioned reasons, an activity on vision-based diagnostics was initiated in 2004 with the primary focus of developing an application to perform automated, continuous monitoring using thermographic and visual light cameras.
The primary features of the Vision tool are:
- Continuously capture and store images from one or more thermographic and visual light cameras.
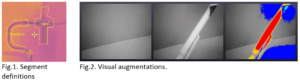
- Allow the definition of any number of irregularly shaped image segments for detailed analysis (see fig.1).
- Perform continuous monitoring to detect any (reasonably large) anomalies, i.e. differences in pixel intensities (for visual images) or temperatures (for thermo-images) as compared to snapshot.
- Apply visual image augmentation to display anomalies (see fig.2).
- Allow playback of entire monitoring sequences or particular anomaly detection sequences.