Fluid inclusion services
Fluid inclusions are sealed “containers” of fluids trapped in minerals. Fluid inclusions can be thought of as time capsules storing information about ancient temperatures, pressures, and fluid compositions.
Fluid inclusions are vacuoles sealed within minerals. When trapped within diagenetic and ore-forming minerals, they provide the only direct means of examining the fluids present in ancient geological systems.
They may provide the following valuable information with simple petrographic observations, microthermometric analysis, or sophisticated geochemical analysis of inclusions contents:
- Temperature of mineral precipitation
- Pressure of mineral precipitation
- Composition and origin of fluids of mineral precipitation
- Later history of temperature, pressure and fluid composition
- Improve understanding of diagenetic- and ore-forming systems
- Improve understanding of subsurface fluid evolution
- Improve interpretation of petroleum migrating history
Natural processes have provided:
- Constant volume
- Constant composition

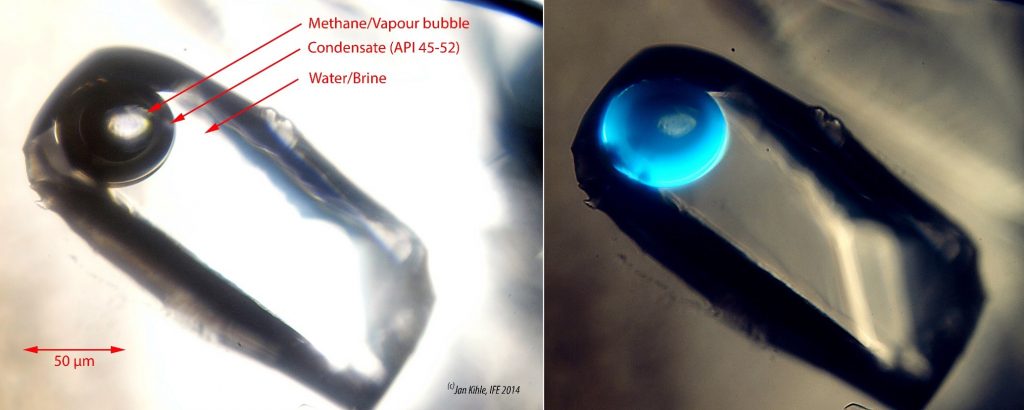
Figure: Primary HCFI with Permian age condensate mixed with brine hosted in quartz. From Søndeled, On-shore Norway. Combined white light and 366 nm UV light.
Fluid Inclusion Analytical Services tendered
Textural Mapping
- Abundances of petroleum inclusions
- Presence of diverse types and generations of aqueous (AqFI) and petroleum inclusions (HCFI)
- Appearance of HCFI (bubble size, color, fluorescence emission, presence of solids, etc.)
- Time of trapping of HCFI relative to the diagenetic sequence
- Textural occurrence of AqFI and HCFI in autigenic (diagenetic) minerals
- Photographic documentation
Microthermometry
- Homogenization temperature (i.e. the disappearance of vapor bubble or liquid phase in petroleum or aqueous inclusions)
- Clathrate melting temperature in mixed petroleum and aqueous inclusions
- Ice melting temperature for salinity estimation of aqueous fluids
- Hydrate melting temperature for Ca/Na ratios of aqueous fluids
Fluorescence Emission Spectroscopy
- Emission spectra within 380-750 nm
- Correlation with API density – the reclaimed IFE Q580 parameter
Gas Chromatography
- Quantified gas composition (C1-C5)
- Quantified compositional parameters in the C7 range
- Semiquantification of pseudocomponents (C6 to ≈C30)
Isotope compositions of inclusion gases
- 13C compositions of individual gas components (C1-C5, CO2)
Data Interpretation
- Integration of analytical data
- PVT modelling
- Evaluation of fluid flow patterns
Petroleum Inclusions (HCFI)
Quick look mapping
- By immersing raw sample rock chips into non-toxic highly refractive fluids in a custom made micro-instrument adapting premium quality UV-transmissive optics, the initial stage differentiation between barren samples and fluid inclusion rich samples becomes an ease, significantly reducing time and funds spent on samples which would add no value. (This methodology was invented by IFE in 1994.)
- Qualitative evaluation of fluid composition based on vapor bubble size, color and fluorescence emission
- Petrographical distribution and abundances of different fluid types

Reservoir filling history – the dating concept
- The textural relationship between the fluid inclusions and their host minerals can be used as a “dating tool”.
- Changes in fluid composition during various stages of the diagenetic history of the reservoir can be established.

Migration: Pressure or composition compartments?
Microthermometric results of aqueous and petroleum inclusions which are trapped at the same time, give important constraints on fluid phase relationships.

Trapping temperature of both aqueous and petroleum inclusions is equal to the homogenisation temperature of the aqueous inclusions. The difference between the homogenisation temperature of the aqueous and petroleum inclusions gives indication of the degree of under-saturation of the petroleum.
A: An oil field which is very close to gas saturation.
B and C: Two compartments of the same field. The lower homogenisation temperatures of petroleum inclusions in C indicate significant under-saturation, due to overpressure.

Fluid Inclusion Fluorescence Emission Spectroscopy
A compositional fingerprint on microscale….….or how to resolve complex filling histories:
The correlation of Petroleum density (° API) with fluorescence spectroscopy – the Q580 parameter.

Figure 6: Fluid inclusion fluorescence emission spectra from a suite of Calcite and Baryte samples from Svalbard, ranging from light oils to asphaltene-rich compositions (Q580 = 0.18 – 0.79).

Gas- and Light Hydrocarbon Components
Generation, migration, mixing, biodegradation
…. are processes which can be addressed by characterization of molecular and isotopic composition of natural gas. Typical applications of natural gas data are source-fluid correlation and evaluation of maturity and biodegradation.
From fluid inclusions:
Composition and δ13C of individual gas components [C1-C5, CO2) from inclusion fluids may now be analyzed.
The figure shows an example of comparison between the δ13C results from fluid inclusion and Drill Stem Test (DST) samples from the same well.

A tool for fluid correlation …….
Recent work has shown some of the light hydrocarbon parameters to be excellent tools for fluid and source rock correlations. This is especially valuable fingerprints for condensates.
….or constraints on migration?
Light hydrocarbons are sensitive to fluid phase relationships. The light aromatics (as benzene and toluene) have a relatively high solubility in the aqueous phase. The content of light aromatics in the oil should thus be a measure of the amount of water “seen” by the oil during migration. Low contents of light aromatics may hence indicate a long migration distance.
Recent instrumental developments have enabled quantitative analyses of light hydrocarbons in fluid inclusions. Together with data from microthermometry on fluid phase relationships, this gives a powerful tool for fluid characterization through time.
Basin Dynamics
Temperature control from fluid inclusions
Diagenetic processes are crucial for reservoir quality of deep prospects. Temperature control from geochemical analyses gives
- Data for integration with basin modelling
- A link between diagenetic processes and basin evolution

Aqueous salinity
An indicator of basinal hydrodynamics
Aqueous basinal fluids may show large compositional variations in time and space. Analysis of aqueous inclusions trapped in diagenetic minerals enables characterization of salinity and sometimes also Na/Ca ratios and constitutes a tool for resolving basinal hydrodynamics.


