Core Data Viewer
Contact us

Functionality
The Core Data Viewer is a visualisation tool that displays a 3D visual representation of reactor core data from calculations or measurements. The data visualised can represent various physical phenomena such as power density, xenon and burn-up distribution. For physicists, more detailed information on flux, void, and temperature distribution, can be displayed. While the tool offers a graphical visualisation of users’ calculation results, it contains no core data calculation functionality itself, so is open to receive data from a variety of calculation codes.
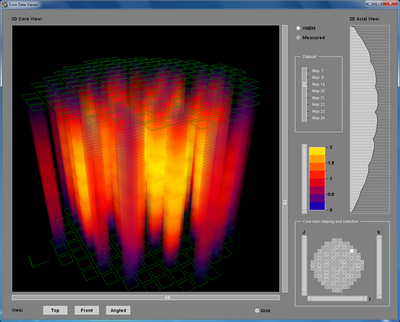
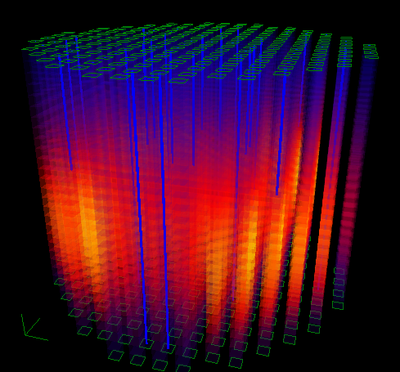
For the core view visualisation, a 3D model of the core is divided into segments, and a data value is presented for each segment of each fuel assembly as shown in the figure to the right. Furthermore, individual fuel pins of an assembly can be shown in a separate fuel pin view, for a fuel assembly selected by the user. In the fuel pin view, a data value is presented for each segment of each individual fuel pin. Control rods and their vertical positions are displayed in both the core and the fuel pin views.
The data is presented using a user-defined colour scheme, typically a continuous colour transition from low-range to high-range values. Together with the colour, the user can also specify the amount of transparency to use for a range of values. This enables the user to make the most interesting values appear more solid than values outside the range of interest, and thus emphasise the segments of fuel assemblies that have interesting values. The user can rotate the core both horizontally and vertically, to view the core from any angle.
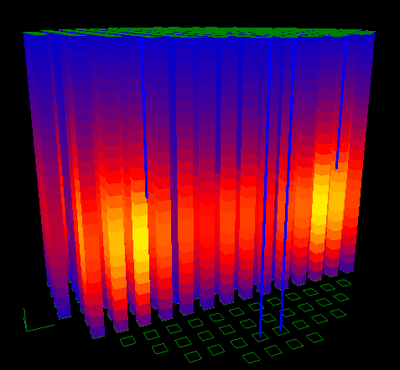
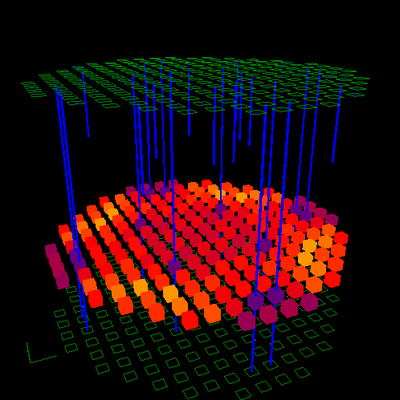
By cutting planar cross-sections along any major axis, the user can study interior fuel assemblies or fuel pins anywhere within the core. Cutting plane can be moved along axes by dragging corresponding slides in the user interface. Ref figure 3 and 4 below.
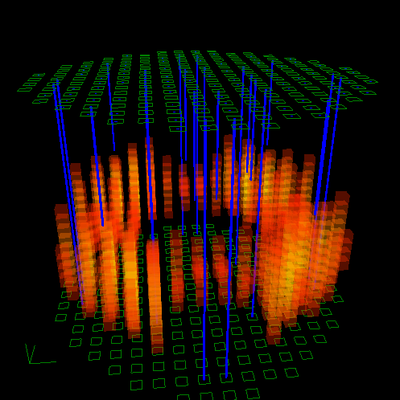
By dragging a slider, the user can specify lower and upper threshold values, visualising only segments of fuel assemblies or fuel pins with data values within those limits. This feature provides a fast way of identifying the most interesting spots. Ref figure 2 below.
Application areas
Three major application areas have been identified as candidates with best potential for benefiting from using the Core Data Viewer:
- Core management services, including core design. This is typically an offline activity where fuel vendors’ and utilities’ reactor physicists discuss and optimise different core loading patterns. Detailed, accurate, and time-consuming calculations produce massive amounts of data, and the Core Data Viewer provides a means to visualise the data and to assist in obtaining a common interpretation of the calculated results.
- Core monitoring where reactor operators and on-site reactor physicists use Core Data Viewer to visualise data from core simulation codes. On-line measurements can be included in order to compare and verify simulation results. Although the Core Data Viewer currently provides no support for online connection to simulation codes, such features are provided by the underlying technologies used and can easily be incorporated.
- Training of reactor physicists, instructors, and reactor operators, to better understand reactor core behaviour under various operating conditions.
Configuration
Core Data Viewer is configurable with respect to the size and number of fuel pins, fuel assemblies, control rods, axial segments and several other parameters. So far, it has been used to visualise data for BWR, PWR and Candu reactors. Configuration and data files are textual to increase portability and ease-of-use. Therefore file contents can be produced easily, given data from simulations, calculation codes, online measurements, pre-recorded data or combinations thereof.
The user can load multiple datasets into the Core Data Viewer at once, and drag a slider to switch between sets. View settings, including rotation, threshold values, and cross-section cuttings, remain unchanged while switching between datasets. This enables the user to easily make visual comparisons of sets of data.
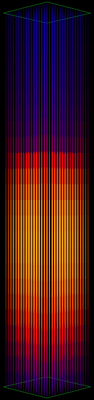
Example visualisations
A few examples of Core Data Viewer visualisations are presented below. The blue lines indicate control rod positions.
|
|
|
|
|
|
|
|